
Predicting the Outcome of Chess Games
Approximating the expected score and draw rate based on rating difference and colorsOne thing I’ve never looked into is predicting tournament outcomes. However, to do this, one must first be able to predict the outcome of a single game. So this is what I’ll be doing in this post, before looking into tournament predictions in the future.
As a reference for my result prediction, I’ll use the outcomes of OTB classical games played between players rated 2500+ in the last 10 years. Limiting the rating and timeframe reduces the sample size a bit. But I want to predict current top level tournaments, so I only want to look at high level players and don’t want games from the pre-computer era to influence the results.
Predicting game outcomes
Predicting the outcome of a single game in chess is made easier by the Elo rating system. The rating difference between two players actually represents the expected score in a game between them. If player A has the rating R_A and player B has the rating R_B, we can calculate the expected score of player A as follows: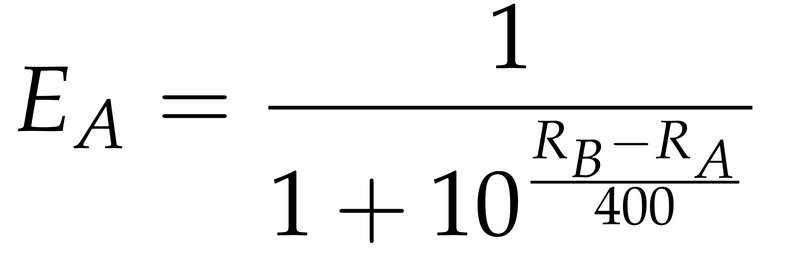
This makes an easy starting point, but there are two important details that the basic Elo formula doesn’t consider, namely the advantage of playing white and the number of draws.
First move advantage
The Elo formula doesn’t differentiate between the colors of the players. However, the impact of the color on results can be seen in the following graph showing the scores of 2700 players with white and black against players of other ratings.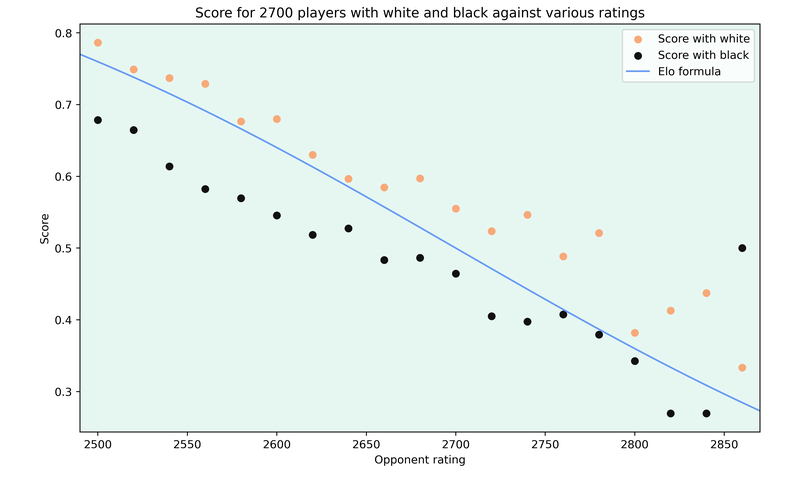
The Elo formula overestimates the score of players with black and underestimates the score of the players with the white pieces.
One way to correct this is to adjust the rating of the players based on the color. By giving white an additional 35 rating points, the expected score with each color fits the data much better.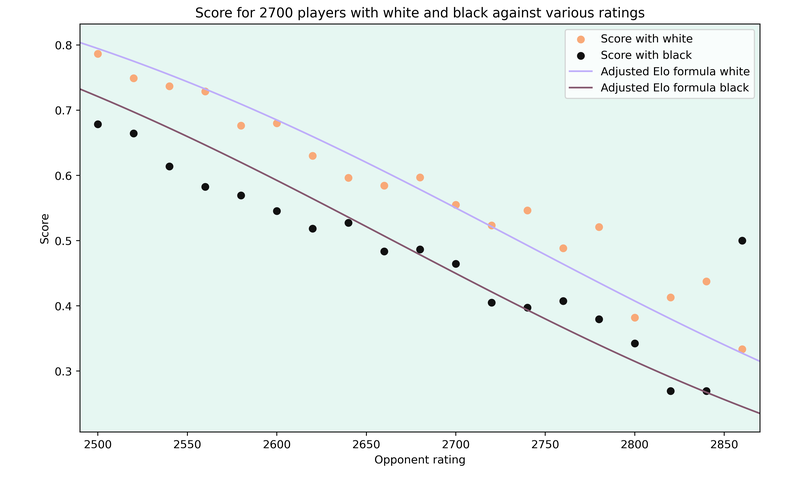
The curves are now closer to the data points, but one interesting observation is that 2700 players score worse than expected against players rated below 2600. Since I’m using games going back to 2015, this may have improved with the changes to the rating system in 2024.
Draw rates
As mentioned above, the other shortcoming of the Elo formula is that it doesn’t tell us anything about the number of wins, draws and losses. So I want to find some formula that roughly describes the number of draws between two players, which can then be used to infer the number of wins and losses.
The first thing I noticed was that the draw rate between players of the same rating varies depending on their rating.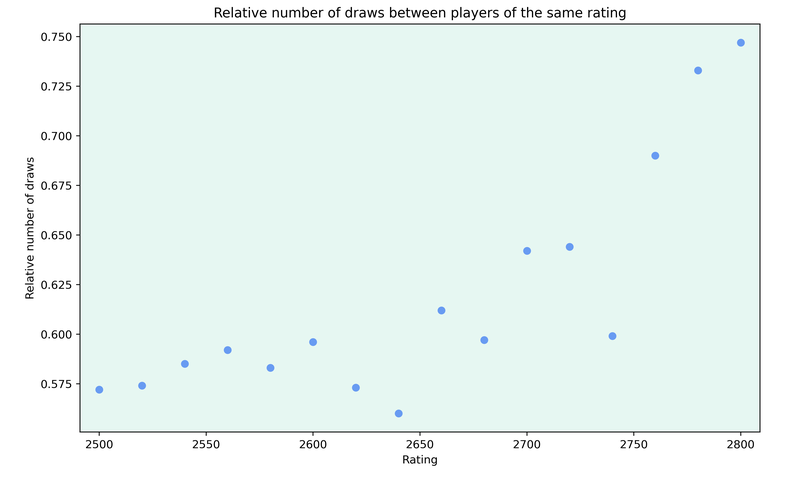
The fact that higher rated players make more draws is very intuitive, especially because players in the 2700+ range spend a lot more time on opening preparation, as playing tournaments is most likely their main focus.
Since I want to make my predictions based on rating difference and there isn’t one value I can use as a base draw rate, I decided to look at how the draw rate changes in games between players of different levels.
Interestingly, the relative value of the draw rate is similar across rating levels.
For example, 2600 players draw around 60% of games played among them. When a 2600 player (with white) plays a 2500 player, they draw 45% of their games, which means the draw rate drops to 75% of its original value. The same holds true when a 2750 rated player (67% base draw rate) plays with white against a 2650 rated player, as they draw around 50% of their games, which is again roughly three quarters of the original draw rate.
So instead of focusing on the draw rate, I focus on the factor by which the draw rate changes compared to games between players of the same level, which I’ll call the relative draw rate.
When looking at this relative draw rate, I again noticed that there is a big difference depending on the color of the players.
From now on, I’ll show everything from the perspective of the higher rated player.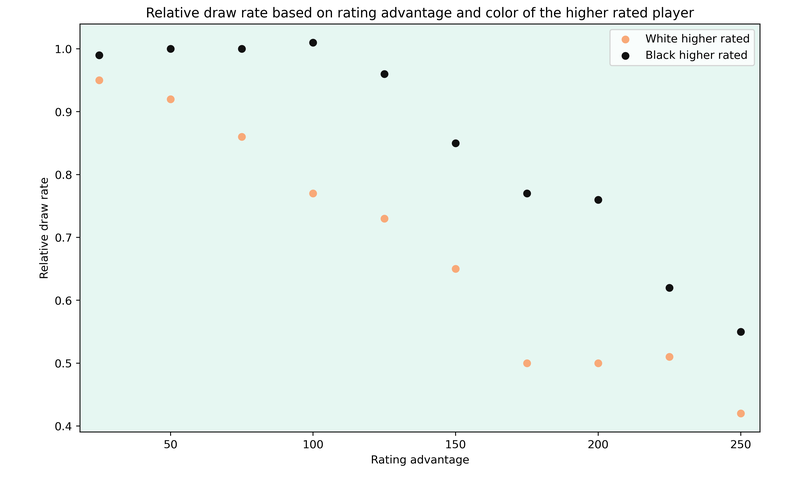
The most striking difference between the colors is that the relative draw rate stays about 1 when the higher rated player is playing with the black pieces, even up to a rating difference of 100 points.
Again, this makes intuitive sense, as lower rated players will try to hold a draw and have decent chances to do that white.
Note however that the higher rated players still score better. So while they draw the same number of games as against players of their rating, they win more games to achieve the better score.
Now to approximate the relative draw rate (RDR) for white, I decided to use a simple linear function.
I got the factor by a linear regression of the data values shown above. I tried some more complicated formulas with a slight sigmoid shape, but they didn’t fit the data any better than the simple linear model.
Note that the linear formula will clearly not work indefinitely, as the value will be negative above a rating difference of 424 points. But this can be resolved by adding a fixed floor, similar to the 400 point rule in the FIDE rating system.
When the higher rated player is playing black, I decided to keep the relative draw rate at 1 if the rating difference is below 100 points and after that I used the same linear formula, but changed the factor to -0.002829 and one has to subtract 100 from the rating difference.
Now we can look at the estimated relative draw rates compared to the real data.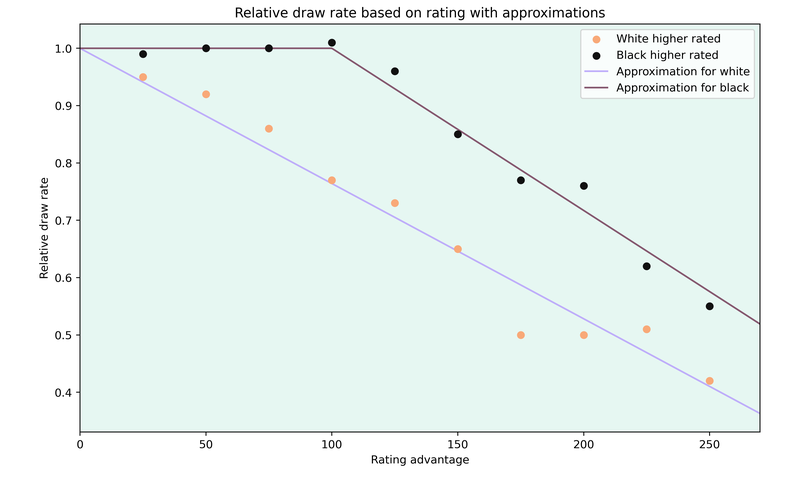
Putting everything together
Now we have a way to approximate the score of a game and the expected number of draws. Using these approximations, we can get a prediction for the outcome of a game. So let’s go through an example.
Assume we have a game where white has a rating of 2600 and black a rating of 2550. By adding the 35 points to white’s rating to account for the first move advantage, we get a rating difference of 85 points and, using the Elo formula, we get that white is expected to score 0.62 points in the game on average.
Now we need to figure out how the score is spread across the different possible results.
The base draw rate of a 2600 rated player is 60%. Using the estimation of the relative draw rate, we get a relative draw rate of 0.88, which means that we expect 0.6 · 0.88 = 0.528 draws per game.
As white scores 0.5 points per draw, they are estimated to score 0.264 points of their expected score via draws. As all the remaining points have to be scored by wins, we expect white to win 62% - 26.4% = 35.6% of the games.
So in total we get a win probability of 35.6% for white, a 52.8% draw probability and a 11.6% loss probability.
What’s next?
Now that I’ve got a way to predict the outcome of a single game, I want to use it to predict the outcome of tournaments and matches. In the next post, I’ll take a closer look into that.
Until then, let me know what you think about this post and feel free to ask any questions.
If you've enjoyed this post, you can Subscribe to my Substack.
You may also like
 jk_182
Do Attacking Players play more Forcing Moves?
Finding forcing moves and looking through the games of world champions jk_182
How Opening Advantages Translate into Results in Online Games
Measuring conversion rates in online blitz and bullet games for 1200 to 2400 rated players jk_182
Concepts Discovered by AlphaZero
Looking at a paper from DeepMind about concept discovery and transfer jk_182
Measuring Level of Play in different Endgame Types
Using Stockfish to see which players improve their winning chances the most in different types of en… thibault
How I started building Lichess
I get this question sometimes. How did you decide to make a chess server? The truth is, I didn't. jk_182